How to Graph a Linear Inequality.
First, graph the "equals" line, then shade in the correct area.
There are three steps:
Rearrange the equation so "y" is on the left and everything else on the right.
Plot the "y=" line (make it a solid line for y≤ or y≥, and a dashed line for y< or y>)
Shade above the line for a "greater than" (y> or y≥) or below the line for a "less than" (y< or y≤).
Another great strategy is to use a test point. If the test point makes the inequality true, then shade to include the point. If the test point makes the inequality false, then shade to not include the point.
Which is the better test point?
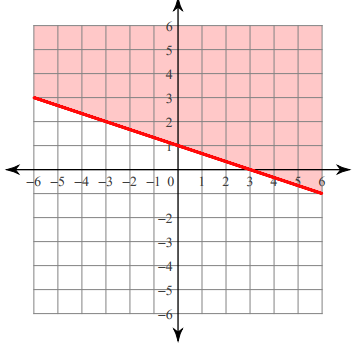
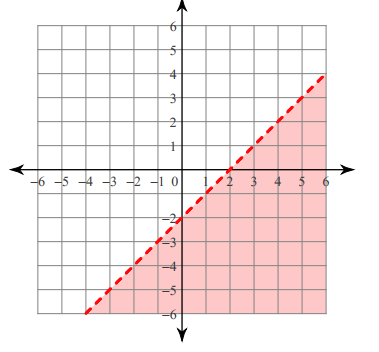
Directions: Look at each graph and decide which test point would make the inequality true.
Directions: Look at each graph and decide which test point would make the inequality true.

(0, 0) OR (-4, 0)
|
(1, 1) OR (0, 1)
|


Where would you shade?
Directions: Look at each inequality. Graph it on a piece of graph paper and share accordingly.
Directions: Look at each inequality. Graph it on a piece of graph paper and share accordingly.
|
|
