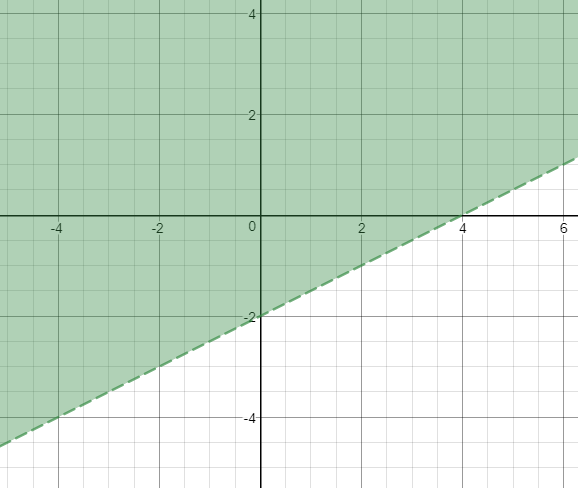
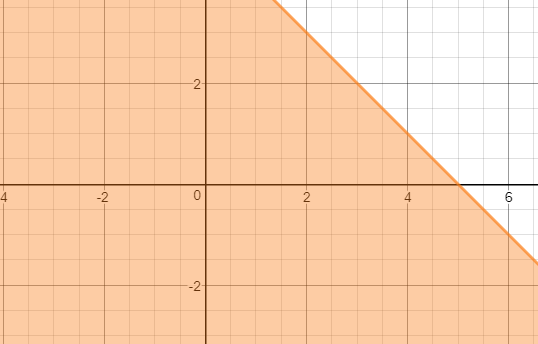
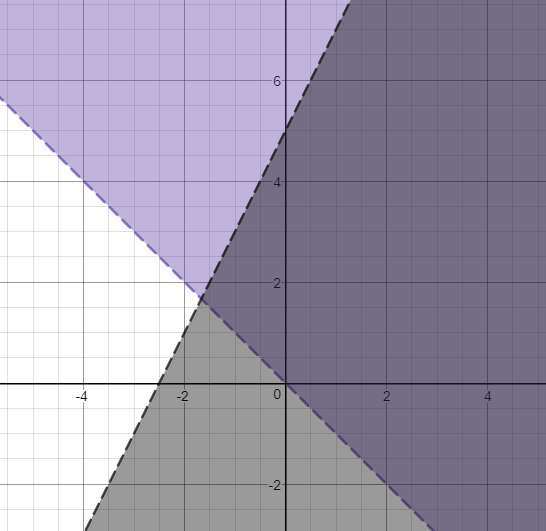
When you are graphing inequalities, you will graph the ordinary linear functions just like before. The difference is that the solution to the inequality is not the drawn line but the area of the coordinate plane that satisfies the inequality. The boundary line is dashed for > and < and solid for ≥ and ≤.
Directions: For each image, decide which symbol accurately represents the inequality.